Pneumonia Detection with Deep Learning
Objective
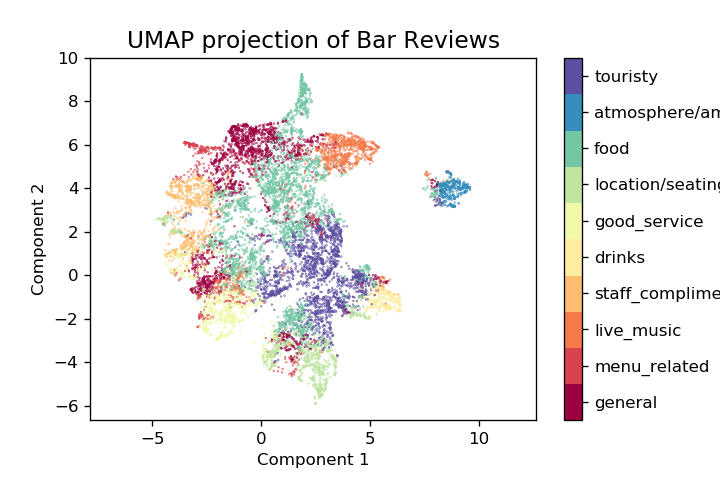
Diagnostic imaging is an important part of a patient’s medical examination, and X-rays are one of the most common methods doctors use to distinguish between patients who are normal and those with disease.
In this project, the goal was to develop a machine learning model that takes in lung X-rays and classifies them as “normal” or “pneumonia”. Tens of thousands of people develop pneumonia every year and a significant portion of these patients may die from the illness if not treated properly. Imaging in the form of X-rays, MRIs, CT scans, etc. are part of the diagnosis process, in conjuction with assessing presenting symptoms. While radiologists are trained to identify key features of disease, patients with subtle changes in their lungs or those with preexisting underlying lung problems that mask or confound the pneumonia effects may pose a challenge in diagnosis. Deep learning can have a huge impact in improving both diagnostic efficiency as well as increase throughput, benefitting both the medical provider/clinics and the patient.
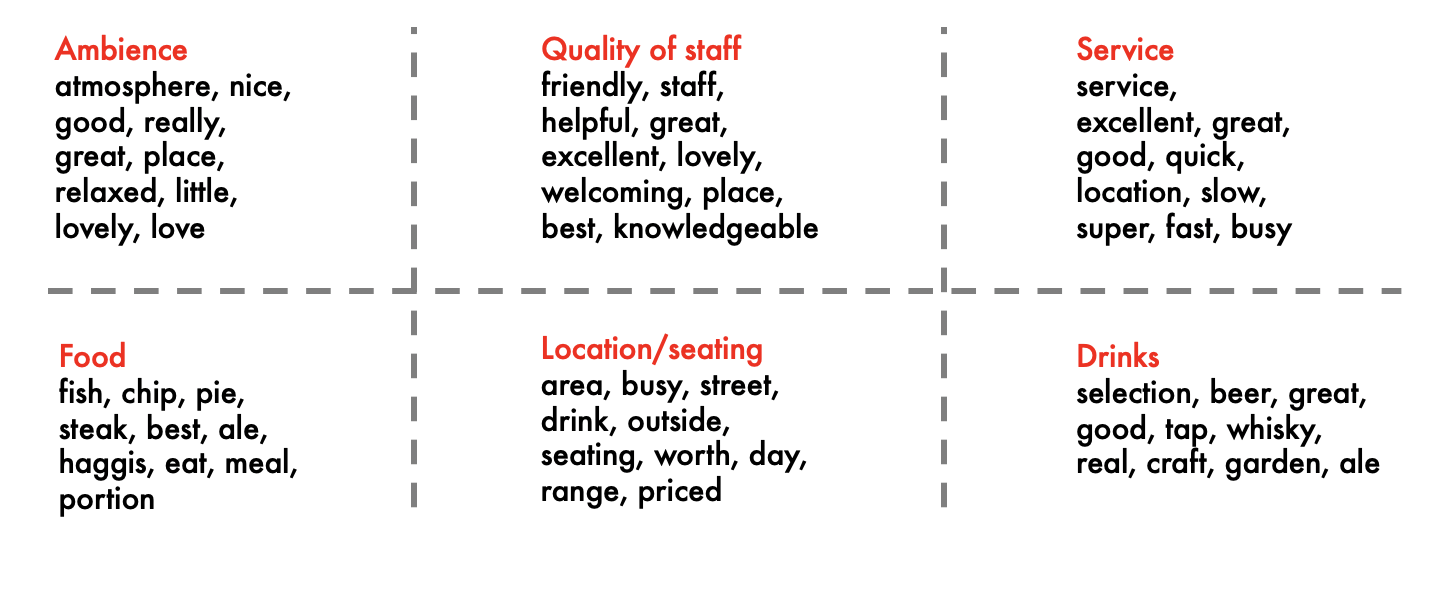
Normal X-Ray:
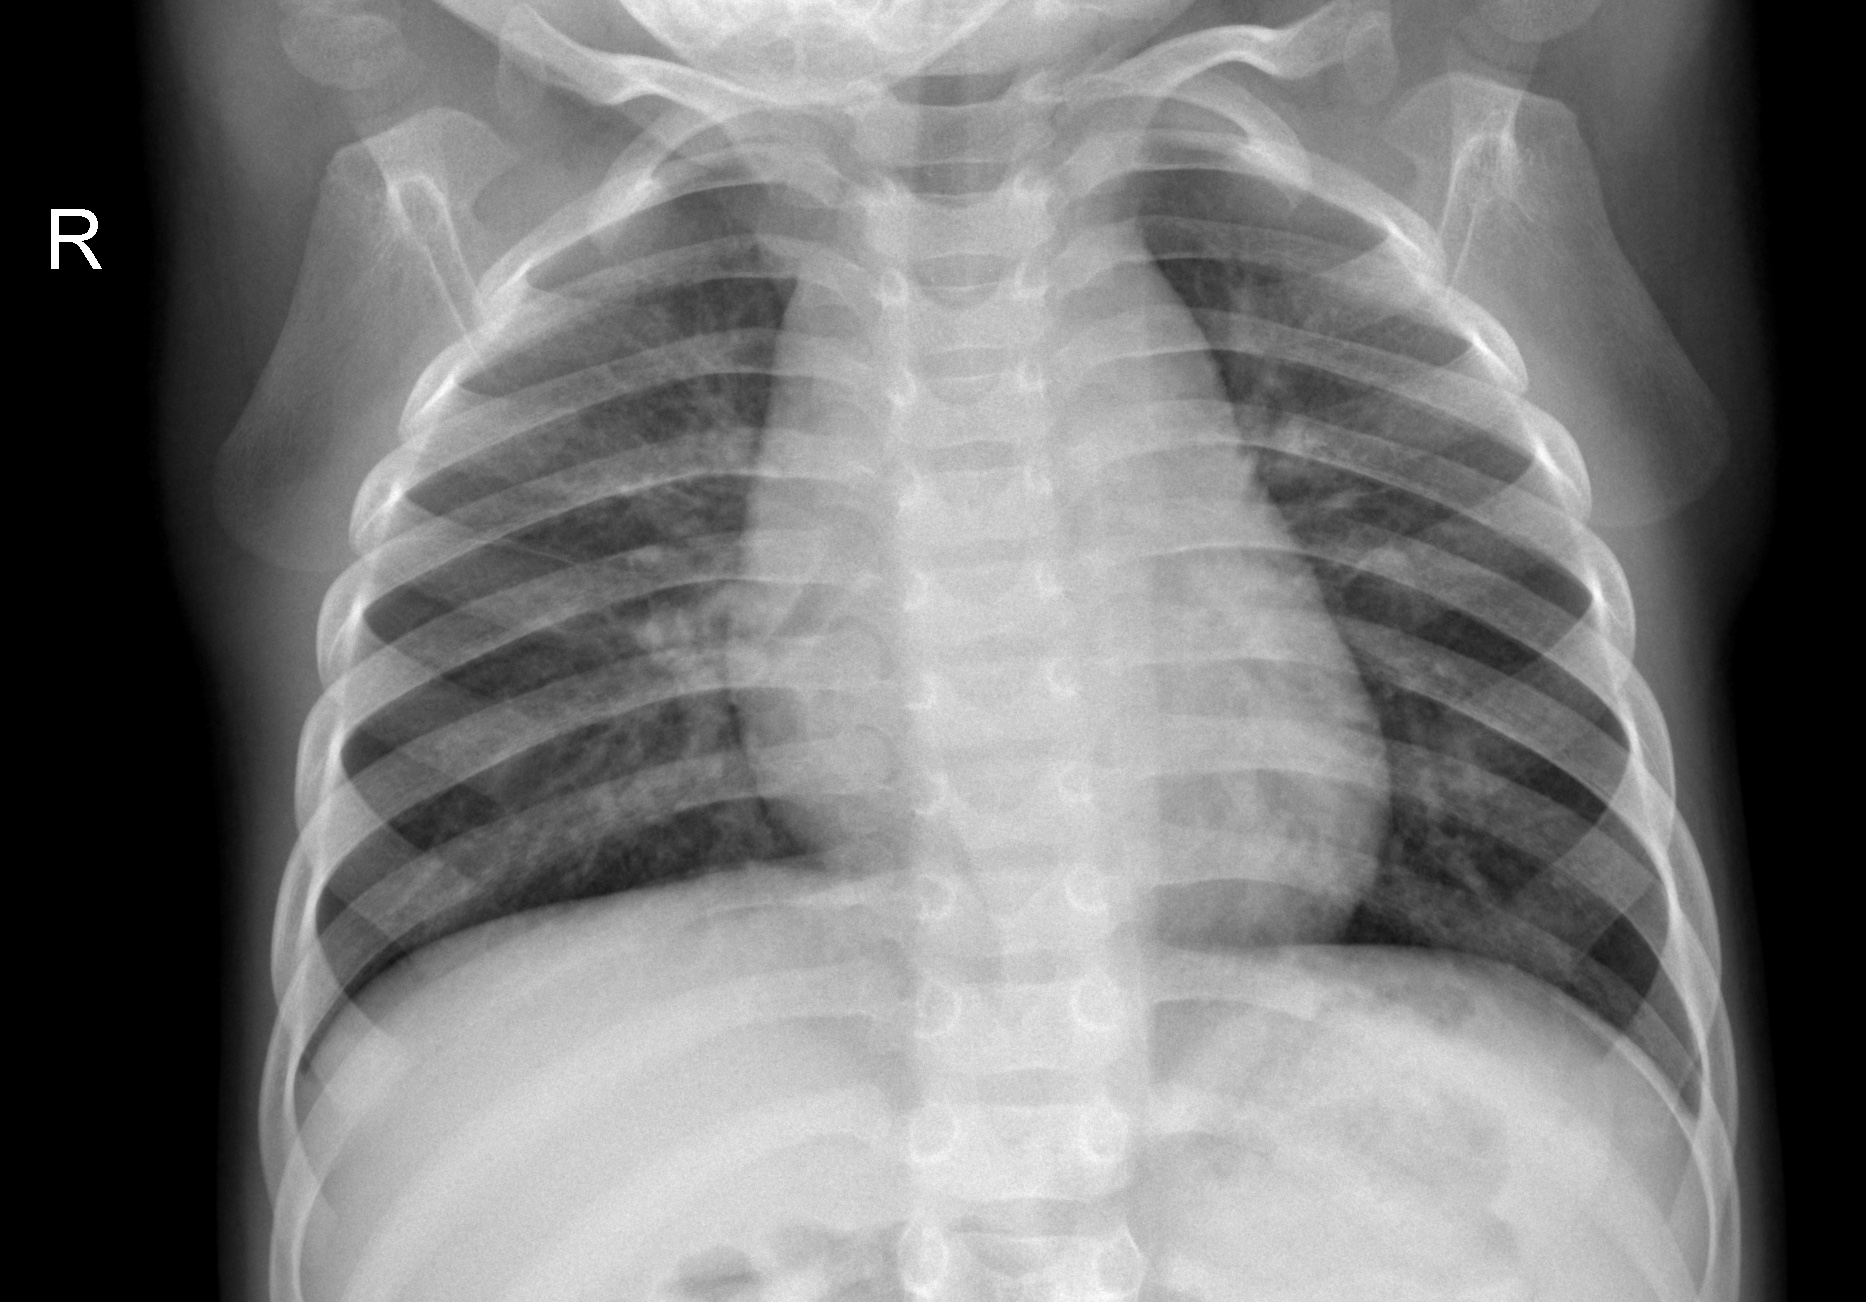
Pneumonia X-Ray:
Methodology
This dataset was found on Kaggle here
The dataset consists of 5856 images in training, validation, and testing folders with Normal and Pneumonia classes in each category.
Initial exploration of the data shows higher numbers of images in the pneumonia groups but overall no imminent need for rebalancing data.
Analyses
Building a convolutional neural network (CNN) to analyze images involved a couple different steps:
-
Architecture: Two convolutional layers each followed by a Max Pooling layer, 5% dropout
-
Optimizer: Adam
-
Loss function: Binary Cross Entropy (Log Loss)
100 epochs were run with an Early Stopping parameter set to end the neural network training process when the model stops improving.
CNN Structure:
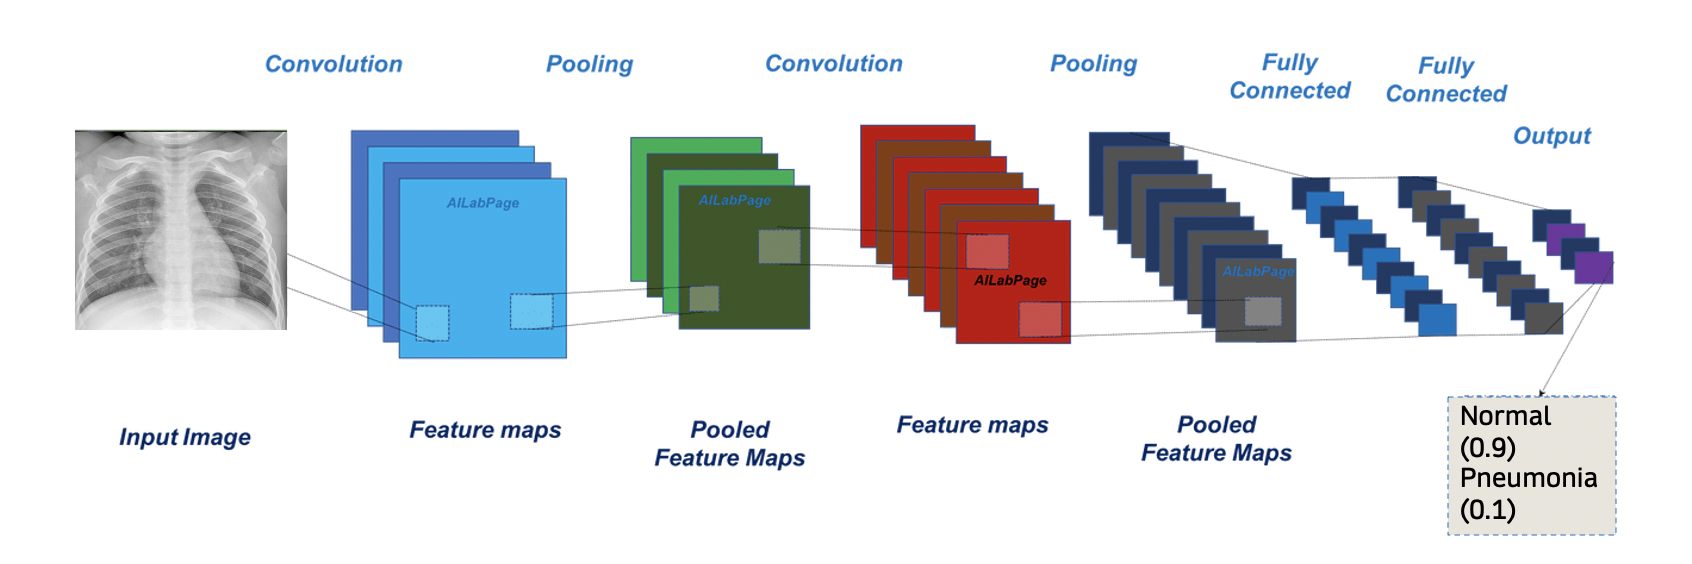
Like other classification models, the CNN classifies each image by outputting a probability between 0 and 1 of which category the image falls into. Depending on the threshold set (here as default), the images will be classified as 0 (normal) or 1 (pneumonia).
Results
The model was able to classify images with 90% accuracy on the testing set. The confusion matrix shows 183 X-rays being correctly classified as normal (true negatives), 378 correctly classified as pneumonia (true positives), 51 misclassified as pneumonia (false positives), and 12 misclassified as normal (false negatives).
Breakdown of classification:
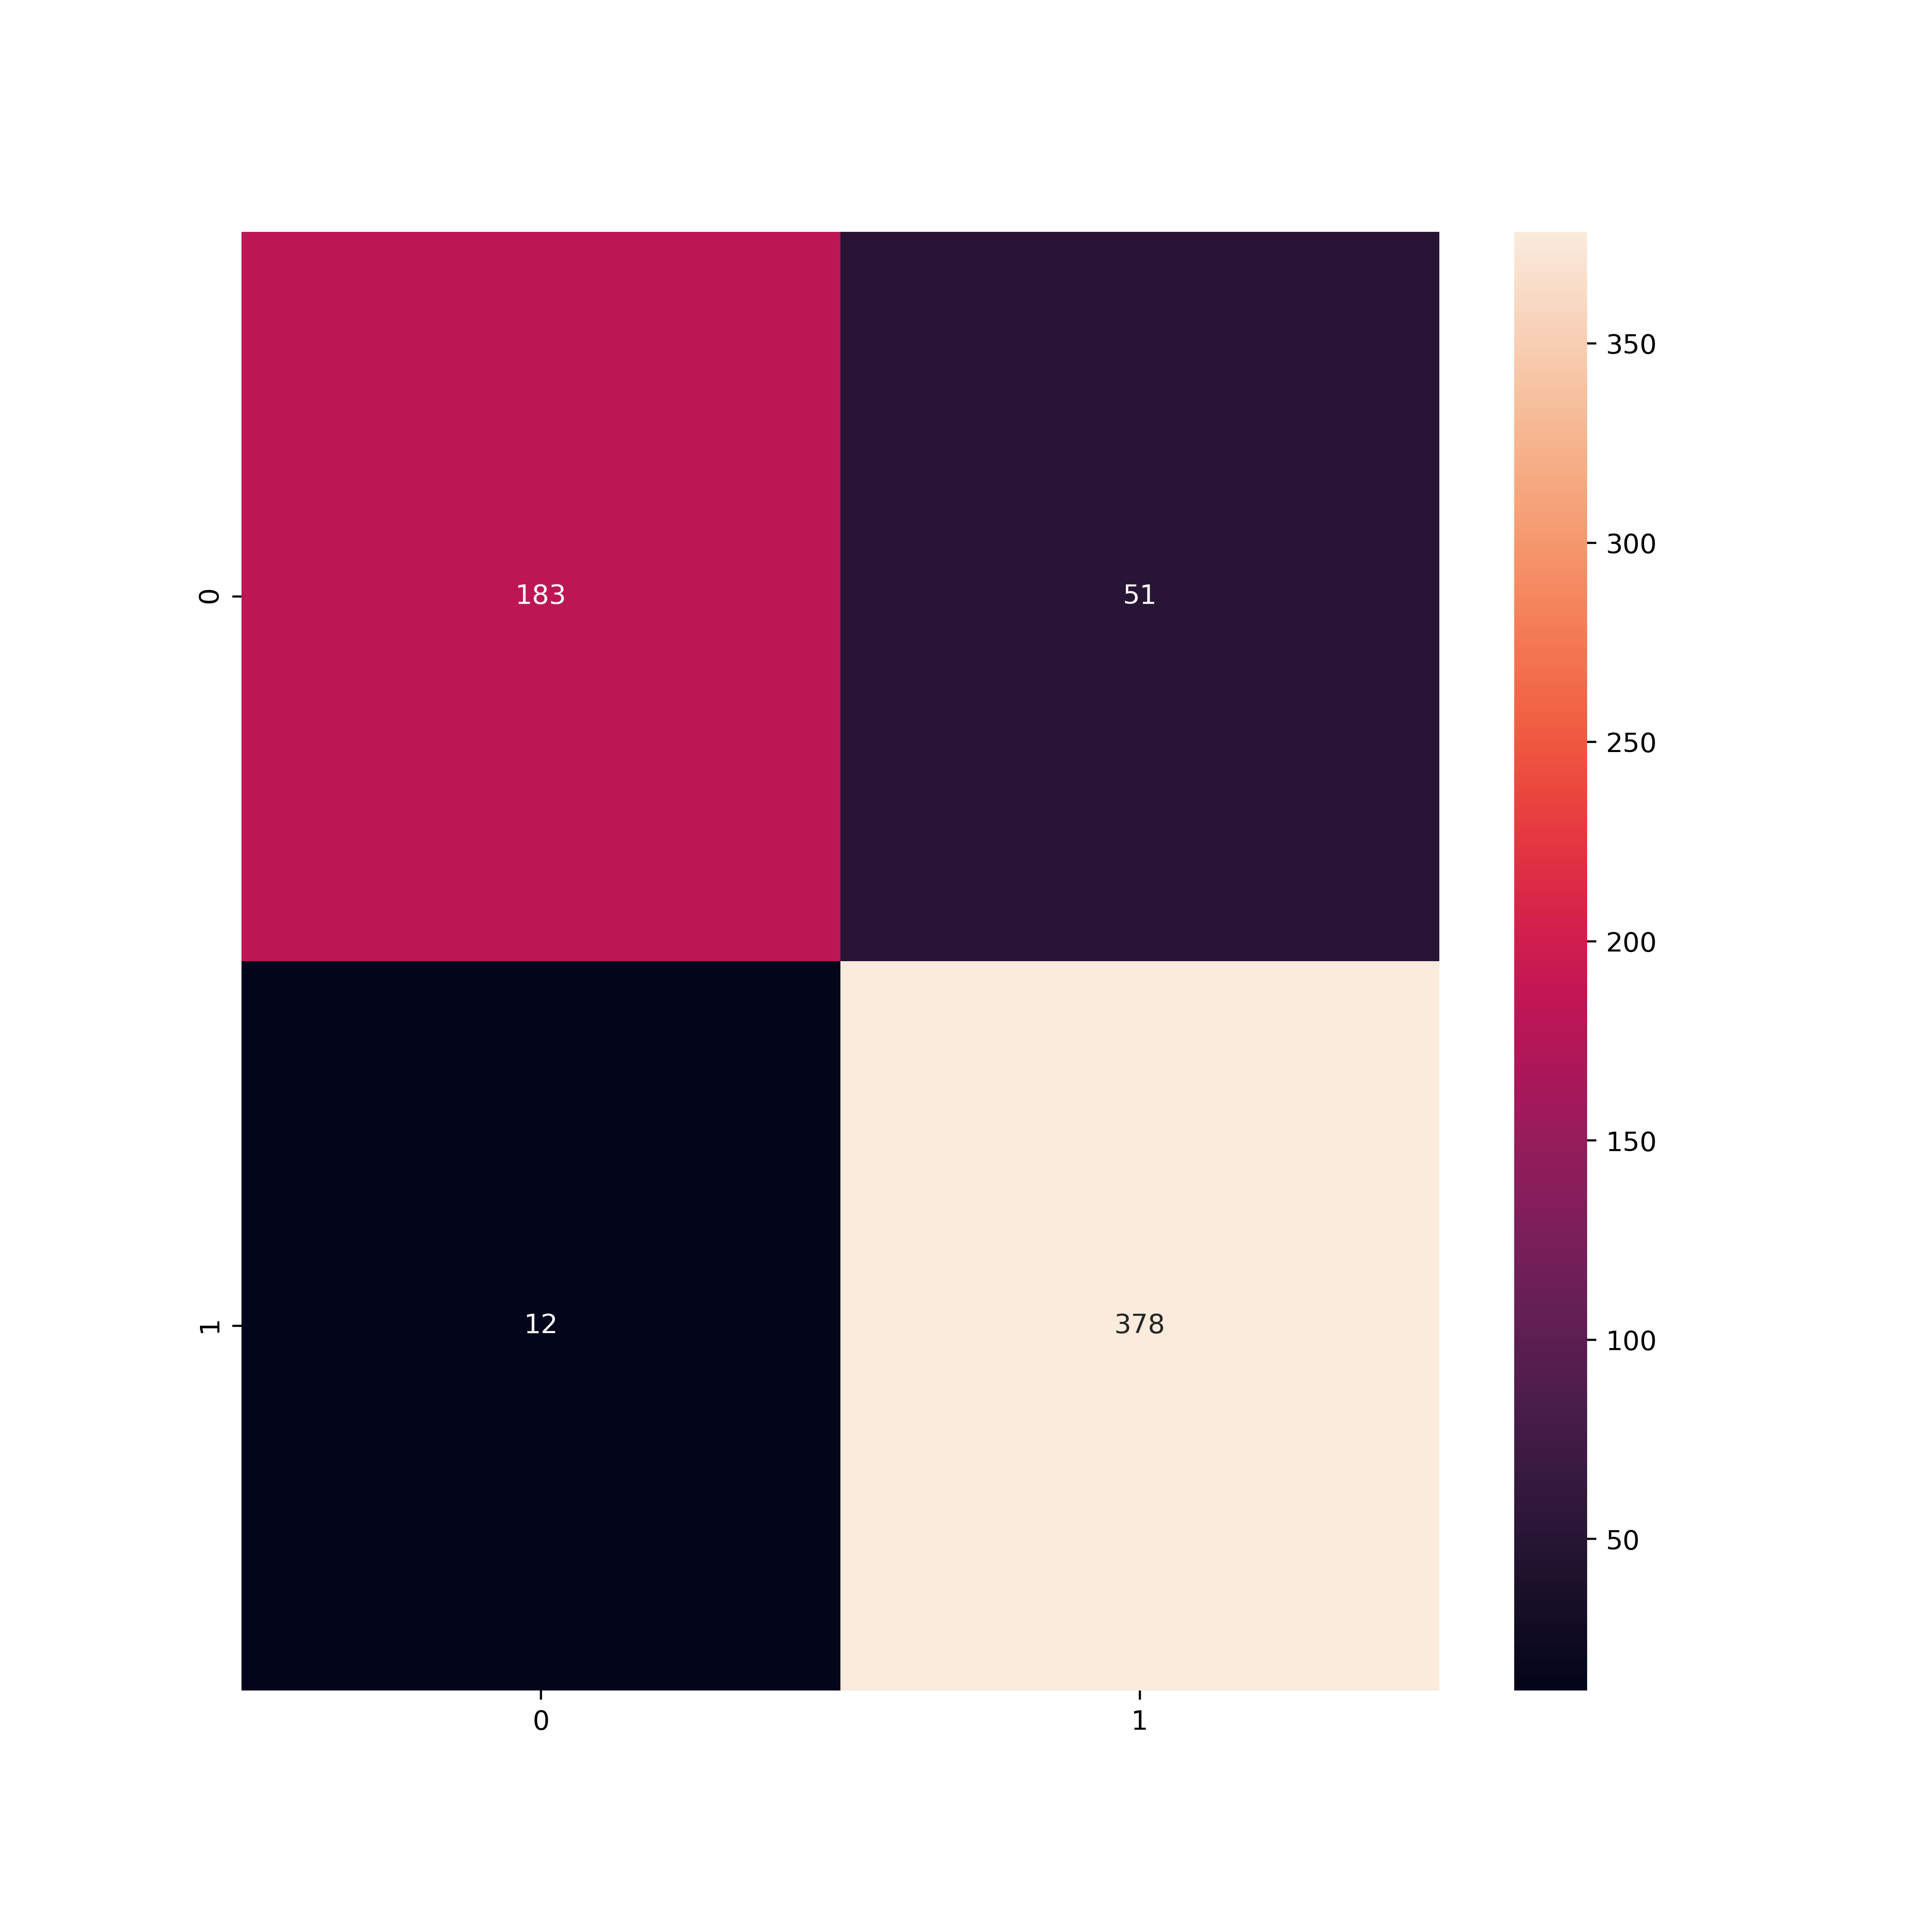
In a medical context, the higher number of false positives are preferable to false negatives. Diagnosis is done with symptoms taken into account and resources towards doing a second check of a patient to confirm they are normal is still more favorable than not catching a patient who actually has pneumonia.
This model performs well on this dataset and future modifications can be done to lower the false positive and negative numbers.
Code for the chosen model and analysis can be found here
Review presentation slides here
For a video of my presentation, please follow this link